Sorry, you need to enable JavaScript to visit this website.

Facts + Statistics: Identity theft and cybercrime

Key Facts

  • According to The Identity Theft Research Center (ITRC) Annual Data Breach Report, 2024 had the second-highest number of data compromises in the U.S. in a single year since the ITRC began tracking data events in 2005, down just one percentage point from the record set in 2023. There was a total of 1.35 trillion victim notices issued including five mega breaches resulting in 100 million to 560 million victim notices issued each, or 83 percent.
  • According to the FBI’s Internet Crime Report 2023, 880,418 complaints of cyber-crime were reported to the FBI by the public, a 10 percent increase from 2022. The potential total loss increased to $12.5 billion in 2023, up from $10.3 billion in 2022. California, Texas, and Florida had the highest number of cybercrime victims.
  • The Federal Trade Commission’s (FTC) Consumer Sentinel Network took in over 6.47 million reports in 2024, of which 40 percent were for fraud and 18 percent for identity theft. Credit card fraud accounted for 43.9 percent of identify thefts, followed by miscellaneous identity theft at 32.4 percent, which includes online shopping and payment account fraud, email and social media fraud, and other identity theft. Florida, Georgia, and Nevada had the most identity theft reports.

Identity theft and fraud complaints

Identity Theft And Fraud Reports, 2020-2024 (1)


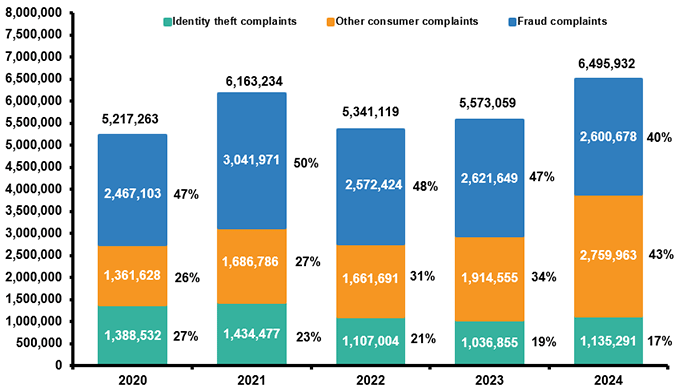
(1) Percentages are based on the total number of Consumer Sentinel Network reports by calendar year. These figures exclude "Do Not Call" registry complaints.

Source: Federal Trade Commission, Consumer Sentinel Network.

View Archived Graphs

Top Five Types of Identity Theft, 2024 (1)


Type of identity theft Number of reports Percent of total top five
Credit card fraud-new accounts 406,110 43.9%
Miscellaneous identity theft (2) 299,201 32.4
Loan fraud-business/personal loan 95,689 10.4
Bank fraud-new accounts 62,982 6.8
Loan fraud-auto loan/lease 60,188 6.5
Total, top five 924,170 100.0%

(1) Consumers can report multiple types of identity theft. In 2024, 14 percent of identity theft reports included more than one type of identity theft.
(2) Includes online shopping and payment account fraud, email and social media fraud, and medical services, insurance and securities account fraud, and other identity theft.

Source: Federal Trade Commission, Consumer Sentinel Network.

View Archived Tables

Identity Theft By State, 2024


State Reports per 100,000
population (1)
Number of
reports
Rank (2), (3) State Reports per 100,000
population (1)
Number of
reports
Rank (2), (3)
Alabama 269 13,596 16 Nebraska 130 2,554 40
Alaska 106 780 48 Nevada 466 14,631 3
Arizona 287 20,863 15 New Hampshire 150 2,079 34
Arkansas 209 6,340 25 New Jersey 313 29,037 11
California 356 139,665 7 New Mexico 150 3,171 34
Colorado 208 12,087 26 New York 295 58,692 12
Connecticut 236 8,502 21 North Carolina 259 27,466 19
Delaware 392 3,942 5 North Dakota 119 924 46
Florida 528 115,840 1 Ohio 236 27,766 21
Georgia 517 55,955 2 Oklahoma 169 6,747 29
Hawaii 138 1,990 38 Oregon 163 6,896 31
Idaho 125 2,367 43 Pennsylvania 290 37,717 14
Illinois 339 43,028 9 Rhode Island 264 2,896 18
Indiana 198 13,471 27 South Carolina 291 15,146 13
Iowa 123 3,919 44 South Dakota 94 845 50
Kansas 154 4,518 33 Tennessee 212 14,829 24
Kentucky 142 6,396 37 Texas 393 116,484 4
Louisiana 346 15,991 8 Utah 157 5,224 32
Maine 127 1,746 41 Vermont 101 651 49
Maryland 324 19,990 10 Virginia 213 18,460 23
Massachusetts 388 27,141 6 Washington 169 13,068 29
Michigan 237 23,783 20 West Virginia 113 2,017 47
Minnesota 127 7,280 41 Wisconsin 149 8,798 36
Mississippi 268 7,903 17 Wyoming 120 697 45
Missouri 187 11,535 28 D.C. 480 3,225  
Montana 131 1,447 39 Puerto Rico 51 1,649  

(1) Population figures are based on the 2023 U.S. Census population estimates.
(2) States ranked per complaints per 100,000 population. States with the same number of complaints per 100,000 population receive the same rank.
(3) Excludes the District of Columbia and Puerto Rico.

Source: Federal Trade Commission, Consumer Sentinel Network.

View Archived Tables

See also the Identity Theft section of our website Click here.

Top 10 Writers Of Identity Theft Insurance By Direct Premiums Written, 2023 (1)

($000)

Rank Group/company Direct premiums written (2) As a percent
of total direct
premiums written
1 State Farm $36,014 14.9%
2 Nationwide Mutual Group 29,535 12.2
3 Travelers Companies Inc. 23,104 9.6
4 Hanover 15,598 6.5
5 Liberty Mutual 12,767 5.3
6 American Family Insurance Group 11,627 4.8
7 Erie Insurance 10,956 4.5
8 Farmers Insurance Group of Companies 10,672 4.4
9 Allstate Corp. 9,420 3.9
10 Munich Re 8,244 3.4

(1) Includes stand-alone policies and the cybersecurity portion of package policies. Does not include premiums from companies that cannot report premiums for cybersecurity coverage provided as part of package policies.
(2) Before reinsurance transactions

Source: NAIC data, sourced from S&P Global Market Intelligence, Insurance Information Institute.

View Archived Tables

Cybercrime


View Archived Graphs


View Archived Graphs

Top 10 States by Number of Cybercrime Victims and by Losses, 2023 (1)


Rank State Number Rank State Losses
($ millions)
1 California 77,271 1 California $2,159.5
2 Texas 47,305 2 Texas 1,021.6
3 Florida 41,061 3 Florida 874.7
4 New York 26,948 4 New York 750.0
5 Ohio 17,864 5 New Jersey 441.2
6 Arizona 16,584 6 Pennsylvania 360.3
7 Pennsylvania 16,407 7 Illinois 335.8
8 Illinois 15,783 8 Arizona 324.4
9 Michigan 14,784 9 Georgia 301.0
10 Washington 14,600 10 Washington 288.7

(1) Based on the total number of complaints submitted to the Internet Crime Complaint Center via its website from each state where the complainant provided state information.

Source: Internet Crime Complaint Center.

View Archived Tables

Top 10 Writers of Cybersecurity Insurance by Direct Premiums Written, 2023 (1)

($000)

Rank Group/company Direct premium written (2) As a percent of tota
direct premiums written
1 Chubb Ltd. $573,583 7.9%
2 AXA 487,196 6.7
3 Fairfax Financial Holdings 462,954 6.4
4 Travelers Companies Inc. 384,851 5.3
5 Tokio Marine 377,857 5.2
6 Berkshire Hathaway Inc. 289,300 4.0
7 Arch Capital 282,136 3.9
8 American International Group (AIG) 274,377 3.8
9 Sompo 262,948 3.6
10 Starr International Co. 260,014 3.6

(1) Includes stand-alone policies and the cybersecurity portion of package policies. Does not include premiums from companies that cannot report premiums for cybersecurity coverage provided as part of package policies.
(2) Before reinsurance transactions.

Source: NAIC data, sourced from S&P Global Market Intelligence, Insurance Information Institute.

View Archived Tables

Additional resources

Back to top