MEMBERSHIP
AMPLIFY
EN ESPAÑOL
Connect With Us
- Popular search terms
- Automobile
- Home + Renters
- Claims
- Fraud
- Hurricane
- Popular Topics
- Automobile
- Home + Renters
- The Basics
- Disaster + Preparation
- Life Insurance

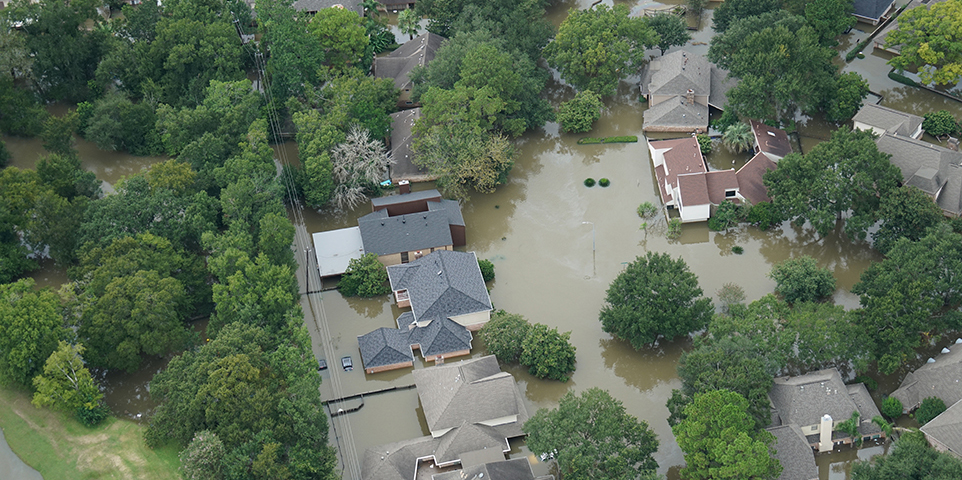
Flood damage is excluded under standard homeowners and renters insurance policies. However, flood coverage is available as a separate policy from the National Flood Insurance Program (NFIP), administered by the Federal Emergency Management Agency (FEMA), and from many private insurers. Industry observers note that many properties that should have flood coverage do not. According to a 2023 Triple-I/Munich Re Consumer Survey, 22 percent of homeowners reported that they are at risk of flood. Of those, 78 percent purchased flood insurance—35 percent from a private insurance provider and 43 percent through the National Flood Insurance Program.
|
(1) Defined by the National Flood Insurance Program as an event that produces at least 1,500 paid losses, since 1978. As of January 2025.
Source: Federal Emergency Management Agency (FEMA) National Flood Insurance Program (NFIP) data; analysis courtesy of Aon.
($000)
|
(1) After reinsurance transactions, excludes state funds and premiums written by private insurers participating in the National Flood
Insurance Program's Write Your Own program.
(2) After dividends to policyholders. A drop in the combined ratio represents an improvement; an increase represents a deterioration.
(3) Calculated from unrounded data.
Source: NAIC data, sourced from S&P Global Market Intelligence, Insurance Information Institute.
($000)
|
(1) Private flood includes both commercial and private residential coverage, primarily first-dollar standalone policies that cover the flood peril and excess flood. Excludes sewer/water backup and the crop flood peril.
(2) Before reinsurance transactions.
(3) Based on U.S. total, excluding territories
Source: NAIC data, sourced from S&P Global Market Intelligence, Insurance Information Institute.
|
(1) Combines materials, equipment and labor, but does not include the value of the land or lot.
Source: CotalityTM, a property data and analytics company.
|
(1) Combines materials, equipment and labor, but does not include the value of the land or lot.
Source: CotalityTM, a property data and analytics company.
|
||||||||||||||||||||||||||||||
(1) The Miami, New York and Houston metro areas studied in this analysis are defined by the Core Based Statistical Areas (CBSAs) of that region. In Miami, this includes the Miami-Fort Lauderdale-Pompano Beach, FL area; in New York City, this includes the New York City-Newark-Jersey City, NY-NJ-PA area; in Houston, this includes Houston-The Woodlands-Sugarland, TX.
(2) Combines materials, equipment and labor, but does not include the value of the land or lot.
Source: CoreLogic®, a property data and analytics company.
|
(1) Rating based on the current statewide residential building code, the processes in place to ensure uniform code application, state and local enforcement programs, licensing and education of building officials, contractors, and subcontractors.
Source: Insurance Institute for Business and Home Safety.