MEMBERSHIP
AMPLIFY
EN ESPAÑOL
Connect With Us
- Popular search terms
- Automobile
- Home + Renters
- Claims
- Fraud
- Hurricane
- Popular Topics
- Automobile
- Home + Renters
- The Basics
- Disaster + Preparation
- Life Insurance
Dr. Robert P. Hartwig, Ph.D.,
Vice President & Chief Economist
Each year before Groundhog Day, we ask a panel of Wall Street stock analysts and industry professionals to come out of their holes, look around for their shadow and forecast the outlook for the industry. Unlike Punxsutawney Phil, who this year predicts six more weeks of cold weather, most analysts expect premium growth to heat up while the combined ratio begins to thaw following a very long winter of discontent.
The average forecast calls for an increase in net written premiums of 14.7 percent in 2002, resulting from a combination of increased prices and higher demand. If realized, the industry will grow at its fastest pace since 1986. Moreover, estimates for net written premium growth in 2001 have been revised significantly upward to 9.8 percent (from 7.4 percent in last year’s survey).

In 2000, industry premiums grew 5.1 percent. As recently as 1998 and 1999, net written premium growth was just 1.8 percent and 1.9 percent, respectively, the smallest increases in post-World War II history.
Sluggish premium growth during the 1990s—principally the result of intense price competition—has clearly given way to much stronger gains. The current hard market was already well under way before September 11, with renewals in most major commercial lines in the 10 percent to 15 percent range. After September 11, the rate of increases for 2002 renewals in many of those same lines roughly doubled to 30 percent, on average. In individual cases, premiums have increased even more, depending on the nature of the business, profile and location of commercial property, and concentration of employees and customers. These increases reflect the heightened risk being assumed by insurers, who had not factored terrorism into premium pricing before September 11. The attacks are expected to cost insurers at least $40 billion. Even taking new capital into account, this historic loss has precipitated a withdrawal of capacity from key markets, thereby reducing the global supply of capital available to pay claims. The Enron debacle, rising jury awards, a sour investment climate and high catastrophe losses continue to chew-up industry capital, precipitating tougher underwriting standards across all lines. At the same time, insurance demand is on the rise as businesses around the world recognize that they face a new and significant risk. As in any other market, when supply falls and demand rises, prices go up.
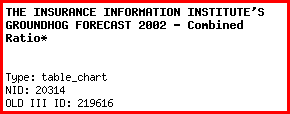
The combined ratio for this year is projected to be 108.1, down dramatically from an estimated 117.7 in 2001. If realized, the industry will see its first decline

in the combined ratio since 1997. Nevertheless, the industry will still be paying out $1.08 for every $1.00 it takes in. The estimate obviously assumes no major insured
losses from terrorist acts in 2002 as well as “normal” catastrophe activity. The 117.7 combined ratio estimated for 2001 is the second highest on record, surpassed only by the 118.0 recorded in 1984.(1) The expected improvement in 2002 underwriting results reflects a better balance between the price of insurance premiums and the increased risk of the post-September 11 environment.
Wall Street has had a love/hate relationship with the insurance industry in recent years. In 1999, for example, property/casualty insurance stocks (on a market cap weighted-basis) lost 25.7 percent of their value (compared to a gain of 21.0 percent for the Standard & Poor’s 500 index and an 86.0 percent rise in the Nasdaq) only to experience a 43.4 percent increase in 2000 (compared to a 9.1 percent decline in the S&P 500 and a 39.3 percent drop in the Nasdaq).
The recent rollercoaster ride in insurer stock prices is easy to explain. Insurance stocks were out of favor in 1999, the year of dot-com mania. In March 2000, as the dot-com bubble burst, the combination of low share prices and the first hints of a hardening market made insurance stocks more attractive, leading to some of the best returns on Wall Street in 2000.
By the end of 2001, property/casualty insurance stocks were down 1.2 percent closing the year far better than the S&P 500, which posted a decline of 10.9 percent (see chart). Across the entire insurance sector stocks performed more on par with the S&P Index, down 7.6 percent. Life/health and multi-line companies led decliners with drops of 7.0 percent and 15.9 percent, respectively. Brokerage companies showed the only positive stock performance, gaining 1.2 percent.
Most insurance stocks were keeping pace with the S&P 500 Index in early 2002. As of February 1, 2002, p/c and life insurance stocks were down 2.0 percent and 2.2 percent, respectively, compared to a 2.2 decline in the S&P 500. Multiline insurers, however, were down 6.1 percent while the decline in the broker segment was just 0.6 percent.
(1) Since at least 1920.
THE INSURANCE INFORMATION INSTITUTE'S GROUNDHOG FORECAST 2002 - Net Written Premiums*
(% Change from Prior Year)
|
*Ranked highest to lowest for 2002.
